Taxonomy On Incorporating Large Language Models in Planning Accepted at ICAPS 2024, 2025

Analytics for automated paper categorization methods

Research Analytics Overview

This page presents our comprehensive analysis of the rapidly evolving literature at the intersection of large language models (LLMs) and automated planning. Our research tracks category drift and emerging trends through an automated extraction and categorization system that continuously monitors new publications.

Building on our initial survey of 126 papers (D₁, until November 2023) organized into eight categories, we analyzed 47 additional papers (D₂, until September 2024). This analysis revealed significant shifts: a decline in six categories, growth in two, and the emergence of two entirely new categories—Goal Decomposition and Replanning—reflecting the field's evolving perspectives on LLM capabilities in planning tasks.

On this page, you'll find: (1) category distribution analysis comparing our two datasets, (2) paper submission workflow illustrating our integration process, and (3) classification performance leaderboard comparing automated and human-augmented methods.

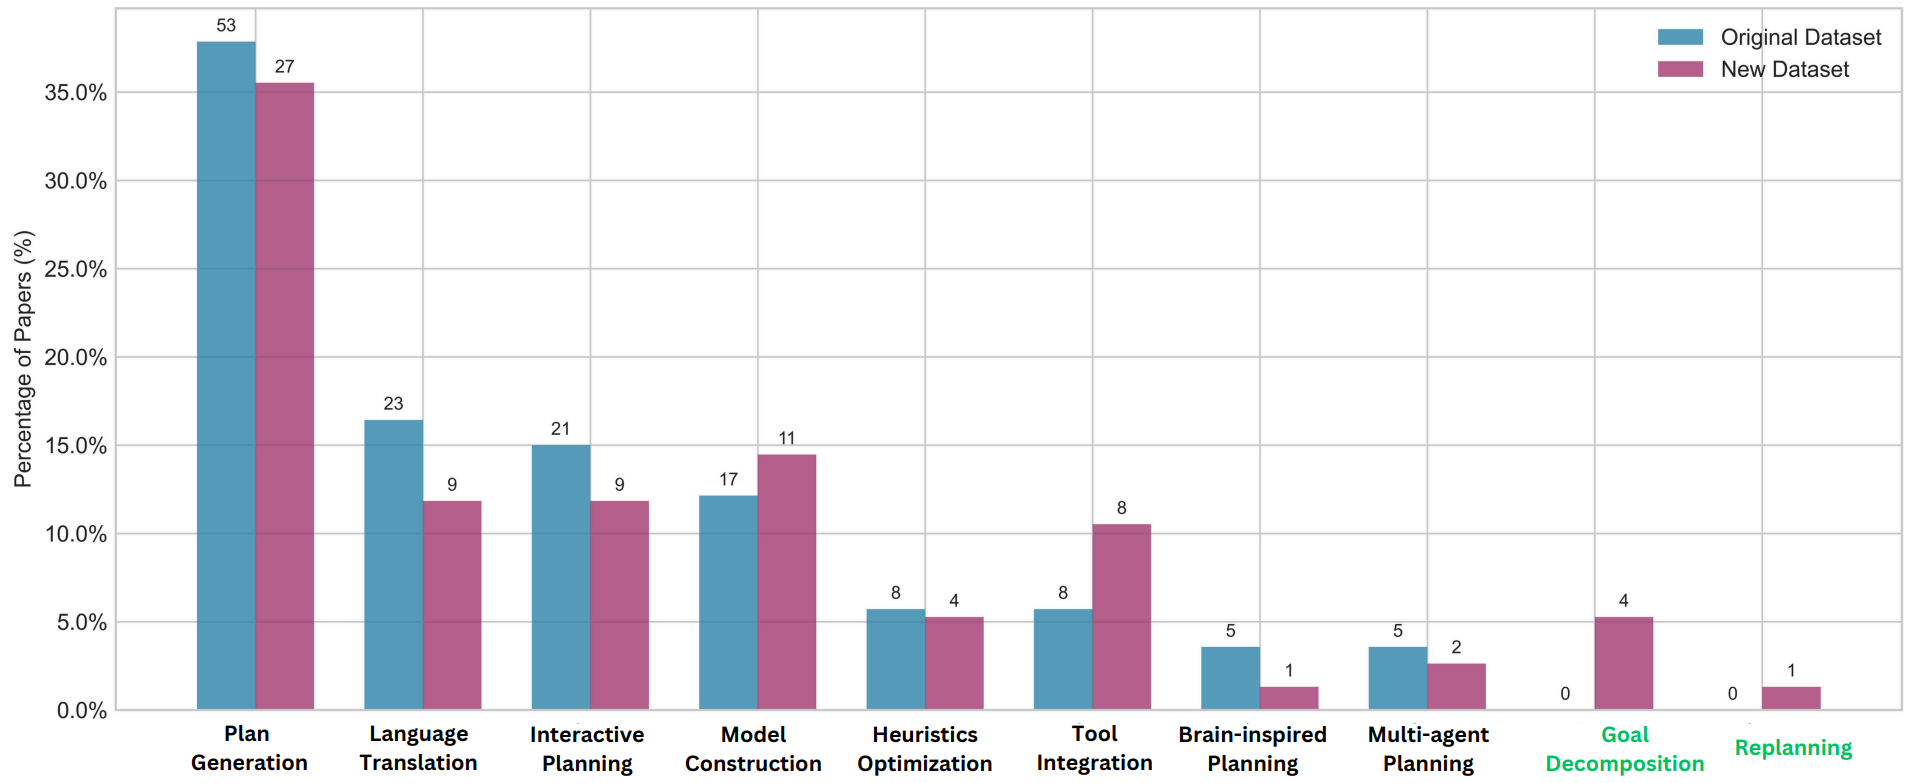
The histogram below compares how research focus has shifted between our two datasets. Notable trends include the continued dominance of Plan Generation (though decreasing in percentage), significant growth in Model Construction and Tool Integration, and the emergence of new categories addressing task structuring and adaptability. These shifts reflect broader recognition that LLMs face fundamental challenges in autonomous planning but excel when integrated within frameworks with external verifiers and specialized tools.

Bar chart comparing category distributions between dataset D1 and D2. Bars are annotated with counts; new categories Goal Decomposition and Replanning appear in D2.
Figure 1: Comparison of category distributions between D₁ and D₂. Percentages shown on the y-axis; counts annotated above bars. The two rightmost categories (Goal Decomposition and Replanning) are newly identified in D₂.

Our platform features an interactive visualization tool that allows researchers to explore systematically categorized papers and submit their own work for inclusion. The flowchart below illustrates the complete process from submission through verification to integration into our database. This workflow ensures quality control while enabling community participation in maintaining an up-to-date taxonomy of LLM-planning research.

Flowchart showing the submission, verification and integration workflow for adding research papers to the visualization tool.
Figure 2: Decision flowchart for adding research papers to the visualization tool. The process includes submission, verification, and integration stages to ensure data quality.

To encourage innovation in automated paper categorization, we benchmark multiple approaches and present their performance below. We compare traditional machine learning methods (SVM, Decision Trees, Random Forests) and transformer-based models (BERT, SciBERT) across both single-label and multi-label classification setups.

Dataset Information: D₁ contains 126 papers (until November 2023), D₂ contains 47 papers (until September 2024). Single-label setup assigns one primary category per paper; multi-label setup allows multiple categories to reflect overlapping research themes.

Key Finding: Decision Trees (DT) perform best among automated methods with an F1 score of 0.349 on the multi-label setup. However, human-augmented classification achieves a substantially higher score of 0.83, demonstrating the critical value of expert review for identifying emerging categories and capturing nuanced distinctions that current automated methods miss.

F1 Macro Scores — Single-label and multi-label setups on datasets D₁ and D₂
Classifier Name Single-Label Setup
D₁
Single-Label Setup
D₂
Multi-Label Setup
D₁
Multi-Label Setup
D₂
SVM 0.222 0.346 0.123 0.280
DT 0.124 0.258 0.233 0.349
RF 0.117 0.213 0.044 0.215
BERT 0.049 0.043 0.102 0.069
SciBERT 0.000 0.013 0.102 0.150
Human-augmented - - - 0.83