GAICo Release News
This page details the major releases of the GAICo library, highlighting key features and providing quick start examples. Use the table of contents in the left sidebar to navigate.
v0.4.0 - January 2026
This release introduces optional seeding for reproducible results across runs. By setting a random seed, users can ensure that any stochastic elements in metric calculations yield consistent outputs.
Key Features:
- The
Experimentclass now accepts an optionalseedparameter (e.g.,Experiment(..., seed=4)). - All metric classes now accept a
seedargument during initialization. - Setting a seed automatically initializes Python's
random,numpy.random, andtorch(for BERTScore) to ensure consistent behavior.
Furthermore, this release includes documentation refresh for better clarity on existing features and usage patterns.
v0.3.0 - August 2025
This release significantly expands GAICo's capabilities by introducing new multimedia metrics for image and audio. It also contains enhancement to the Experiment class by adding support for batch-processing, summarization, and allowing dynamic registration of custom metrics.
Key Features:
- Multimedia Metrics:
- Image: Added
ImageSSIM,ImageAverageHash, andImageHistogramMatchfor comparing visual content. - Audio: Introduced
AudioSNRNormalizedandAudioSpectrogramDistancefor evaluating audio signals.
- Image: Added
- Experiment Class Enhancements:
- Batch Processing: Added support for processing multiple experiments in a single run.
- Summarization: Introduced methods for generating summary reports of experiment results.
- Dynamic Metric Registration: Enabled users to register custom metrics dynamically.
Quick Start Examples
1. Multimedia (Image-only)
Evaluate image outputs against a reference using the new image metrics.
from PIL import Image
from gaico import Experiment

# Tiny demo images
ref = Image.new("RGB", (32, 32), color=(255, 0, 0))    # pure red
img_a = Image.new("RGB", (32, 32), color=(254, 0, 0))   # nearly red
img_b = Image.new("RGB", (32, 32), color=(0, 0, 255))   # blue

exp = Experiment(
  llm_responses={
    "Model A": img_a,
    "Model B": img_b,
  },
  reference_answer=ref,
)

df = exp.compare(
  metrics=["ImageSSIM", "ImageAverageHash", "ImageHistogramMatch"],
  plot=False,
)
print(df.head())
2) Experiment Enhancements (batch + summarize)
Run batch comparisons and get a compact summary with aggregated scores and pass rates.
from gaico import Experiment

# Batch of 3 reference items
refs = [
  "The capital is Paris.",
  "2+2=4",
  "Blue is a color.",
]

# Two models with 3 outputs each (same length as refs)
model_a = [
  "Paris is the capital.",
  "2 + 2 equals four",
  "Blue is a color.",
]
model_b = [
  "London is the capital.",
  "2+2=5",
  "Sky is blue.",
]

exp = Experiment(
  llm_responses={"A": model_a, "B": model_b},
  reference_answer=refs,
)

# Detailed per-item scores (subset of metrics)
scores = exp.to_dataframe(metrics=["Jaccard", "ROUGE"])
print(scores.head())

# Compact summary with pass rates and custom thresholds
summary = exp.summarize(
  metrics=["Jaccard", "ROUGE"],
  custom_thresholds={"Jaccard": 0.5, "ROUGE_rouge1": 0.4},
)
print(summary)

# Optional: one-call compare + CSV report
exp.compare(metrics=["Jaccard", "ROUGE"], output_csv_path="v030_example.csv")
v0.2.0 - July 2025
This release expands GAICo's capabilities by introducing specialized metrics for structured data: automated planning and time series.
Key Features:
- Structured Data Metrics:
- Automated Planning: Added
PlanningLCSandPlanningJaccardfor analyzing planning sequences. - Time-Series: Introduced metrics like
TimeSeriesElementDiffandTimeSeriesDTWfor evaluating time-series data.
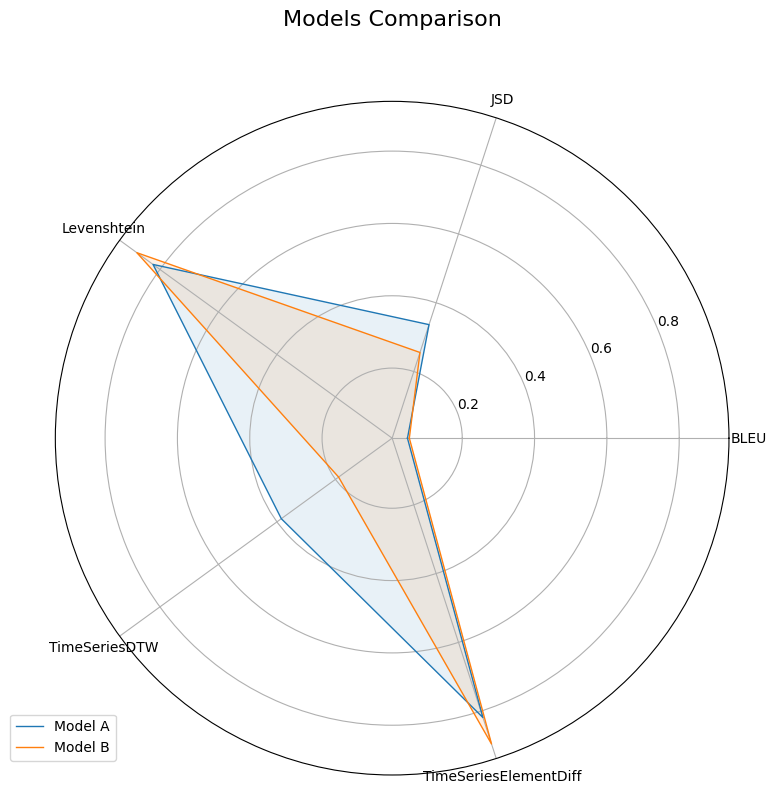
Quick Start Example:
This example demonstrates using the Experiment class with a mix of general and specialized metrics.
from gaico import Experiment

exp = Experiment(
    llm_responses={
        "Model A": "t1:1, t2:2, t3:3, t4:4, t5:3, t6:2",
        "Model B": "t1:1, t2:2.1, t3:3.4, t4:8, t5:5",
    },
    reference_answer="t1:1, t2:2.2, t3:3.1, t4:4, t5:3.5",
)

# Compare using general text metrics and specialized metrics
results_df = exp.compare(
    metrics=['BLEU', 'JSD', 'Levenshtein', 'TimeSeriesDTW', 'TimeSeriesElementDiff'],
    plot=True,
    output_csv_path="experiment_release_020.csv"
)
v0.1.5 - June 2025
This initial release of GAICo focused on providing a solid foundation for comparing general text outputs from LLMs, including core similarity metrics, the Experiment class, and basic visualization tools.
Key Features:
- Core Text Similarity Metrics: Included fundamental metrics such as Jaccard, Levenshtein, Cosine Similarity, and ROUGE.
ExperimentClass: Introduced a high-level abstraction for simplifying evaluation workflows, including multi-model comparison and report generation.- Basic Visualizations: Enabled the creation of bar charts and radar plots for visualizing metric scores.
- Extensible Architecture: Designed for easy addition of new metrics.
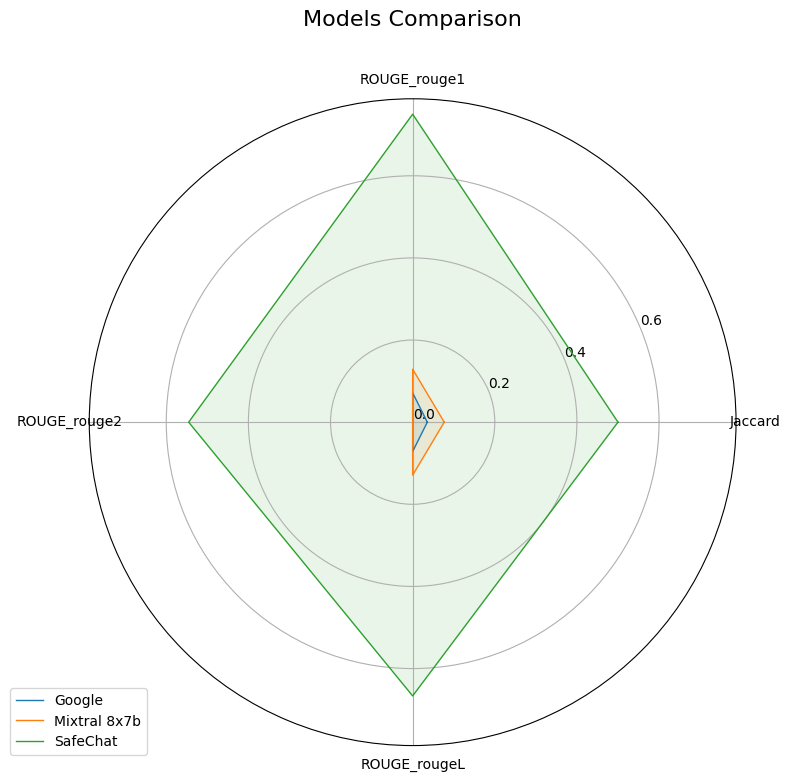
Quick Start Example:
This example showcases the basic usage of the Experiment class for comparing general text responses.
from gaico import Experiment

# Sample data from https://arxiv.org/abs/2504.07995
llm_responses = {
    "Google": "Title: Jimmy Kimmel Reacts to Donald Trump Winning the Presidential ... Snippet: Nov 6, 2024 ...",
    "Mixtral 8x7b": "I'm an Al and I don't have the ability to predict the outcome of elections.",
    "SafeChat": "Sorry, I am designed not to answer such a question.",
}
reference_answer = "Sorry, I am unable to answer such a question as it is not appropriate."

# 1. Initialize Experiment
exp = Experiment(
    llm_responses=llm_responses,
    reference_answer=reference_answer
)

# 2. Compare models using specific metrics
results_df = exp.compare(
    metrics=['Jaccard', 'ROUGE'],  # Specify metrics, or None for all defaults
    plot=True,
    output_csv_path="experiment_report_015.csv"
)